本文為作者Christeen Skinner 專為 美國NCGR占星研究協會 台灣分會提供,並授權翻譯刊登。
金融占星學當中有幾個關鍵的結構,是我在二十年前第一次接觸金融占星學的時候就希望已經能夠留意到的,它們如下:
1.太陽活動 (Solar Activity)
無論交易頻率如何,交易者都需要衡量潛在的波動性,在這方面,他們的第一個停靠港,應該是任何特定時期裡的預期性太陽活動。太陽的功率輸出是變動的,這也許並不令人驚訝,但太陽表面的能量噴發卻經常反映在市場活動的爆發中。大多數人都熟知太陽表面出現黑子及其11.2年的周期。那些對太空氣候感興趣的人也會關注那些被稱之為日冕物質拋射(CME)的能量爆發,它可能使衛星,地面電網和信息系統失去作用,並且可能導致市場混亂,帶給某些人毀滅性的經濟損失。與行星的軌道周期不同,這些CME只能提前幾天進行預報,而且,地球上某些脆弱的地區也無法準確預測。
然而,從太陽能科學家的觀察所收集到的信息是非常有用。術語「無線電通量」用於描述太陽的節奏,可以提前多達27天被預測。當太陽能無線電通量指數上升到50以上時,市場活動增加,這為頻繁或日常交易者提供了有價值的資訊。這些信息可以在www.spaceweather.com上找到,使用起來很簡單:太陽能通量高時,市場波動的可能性增加,一些交易者可能傾向不在這些日期進行交易,而另一些交易者可能考量異常狀況的可能性而改變他們的交易策略。
2. 太陽向點 (the Solar Apex)
我們整個太陽系是在移動的。在你閱讀本段文章的時間內,整個太陽系的太陽、地球、行星、衛星、小行星,以及其他積聚的碎片將行進3600公里。從方向角度看,太陽系似乎是朝著太陽向點的方向移動: 織女星(Vega)的西南方。
.這對你來說可能沒有意義,不過,想到天文學家已經使用的一種繪製天體座標的方法,那就跟地理學家使用經緯度來繪製地球上的某個地方一樣,天文學家也使用設備來繪製天空,這些關鍵性的測量方法就是赤經時間和赤緯(後面將在本章稍後討論)。
相較於我們所熟悉的地球赤道和格林威治0經線,經度和緯度是用來確定我們在地球上的位置;而赤經是始於太陽路徑(黃道)與天球赤道的交會點開始:那個點也稱為春分點。在太陽看起來像是環繞地球的視路徑上,這個點被測定為是赤經0度。
太陽360度的視路徑是從這個點開始被衡量,並以小時和分鐘來描述;而太陽向點則位在赤經 大約18個小時的地方,是對應摩羯座1度的位置。
整個太陽系正朝著我們稱之為太陽向點的方向前進,你可以將它視為是巨大的磁鐵或強大的力量。
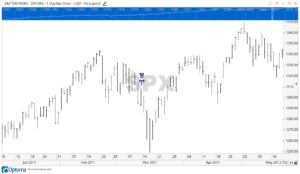
行進緩慢的行星(土星,天王星,海王星,冥王星和新發現的厄里斯)通過這個重要的點時導致了強勁的市場動向。 2011年3月12日,當天王星通過了這個度數時(地心觀點),正如下圖所示:
下一張圖涵蓋了最近土星經過這個度數(再次以地心觀點):再次地,恰好與幾天跌勢交易一致。
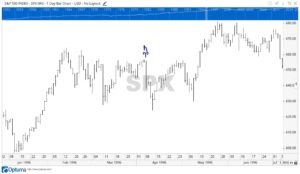
土星只能每三十年穿越這個度數,而天王星則是每八十年一次,所以這個信息對於一般交易者來說並不是令人振奮的消息,但即便如此,這些行星通過太陽向點以及已被證實的市場動態,它們的一致性證明了對於太陽向點及其對應的行星動態應該給予仔細的思量。
你可能會想註記土星和海王星將在2025年與太陽向點對齊,這將會是非常不尋常的,在幾千年的時間裡,它們尚未與這個點對齊過。綜合性的影響可能會與指數急劇下降有關。
但也可能表示全球金融新秩序的曙光。
2018年3月Christeen Skinner版權所有
本文為作者Christeen Skinner 專為 美國NCGR占星研究協會 台灣分會提供,並授權翻譯刊登。
作者介紹:克麗絲汀.史金納(CHRISTEEN SKINNER)
克麗絲汀是倫敦城市觀點公司(Cityscopes London Ltd)總監,該公司為預測未來趨勢的公司。客戶遍及銀行界、商界、企業界等。講座範圍廣及商業占星,德拉古、泛音、中點與時事占星技巧等。克麗絲汀是優拉妮亞信託受託人,亞麗珊卓雅雲端基地計畫的總監,並擔任NCGR顧問團主席。著有金錢符號(Money Signs, 1998年出版)、財金宇宙(The Financial Universe, 2004年出版)、探索財金宇宙(Exploring the Financial Universe, 2016年出版)與財金宇宙的初學者指南(The Beginner’s Guide to the Financial Universe , 2017年出版)、財金宇宙導航(Navigating the Financial Universe)將於2018年出版。
本文翻譯:瑪碁斯老師 校閱:Rosa Wang老師
英文原文請見分頁。
INTRODUCTORY ARTICLE – NCGR TAIWAN – APRIL 22 2018
There are a few key building blocks that I wish had been aware of when I made my first foray into financial astrology two decades ago. They are as follows: –
- SOLAR ACTIVITY
Whatever the frequency of their trading, traders need to gauge potential volatility. In this respect, their first port of call should be to expected solar activity of any given period.
The Sun’s output is variable. It is perhaps unsurprising that bursts of energy in the Sun’s surface are often reflected in bursts of activity in the market place. Most people are familiar with the sunspots that appear on the Sun’s surface and the 11.2 year recognised rhythm associated with these. Those with keen interest in space weather, also pay attention to extra-ordinary bursts of energy known as Coronal Mass Ejections (CMEs) which have the potential to put satellites, terrestrial electric grids and information systems out of action and which, as a direct result, could bring chaos to the markets and, potentially, bring devastating financial loss to some individuals. Unlike the cycles of the orbiting planets, these CMEs can only be forecast a few days in advance and even then, vulnerable areas on Earth cannot be forecast with real accuracy.
Yet there is very useful information to be gathered from observations made by solar scientists. The term ‘radio flux’ is used to describe a solar rhythm that can be forecast for as much as 27 days in advance. When solar radio flux index rises above 50 there is increased market activity which gives valuable information to the frequent or daily trader.
This information can be found at www.spaceweather.com and is straightforward to use: when solar flux is high, then there is increased likelihood of market volatility. Some traders might prefer not to trade on these dates whereas others may alter their trading strategies to take account of the possibility of unusual conditions.
- THE SOLAR APEX
Our entire solar system is on the move. In the time taken to read this paragraph, the Sun, Earth, planets, moons, asteroids and other accumulated debris of the solar system will have travelled 3600 km. In directional terms it seems that the Sun is headed toward the Solar Apex: a position slightly southwest of the star, Vega.
This might mean nothing to you. Consider though that astronomers have worked out a way of mapping the celestial skies. Just as geographers use latitude and longitude to map a place on Earth, so astronomers use devices to map the heavens. These key measurements are Right Ascension and declination (the latter to be discussed later in this chapter).
Whereas the familiar longitudes and latitudes we use to determine where we are on Earth are determined from Earth’s Equator and the 0 meridian at Greenwich, Right Ascension ‘begins’ at the crossing point of the Sun’s path (the ecliptic) with the celestial equator: a point otherwise known as the Vernal Equinox. At this point in the Sun’s apparent journey around the Earth, it is measured as having zero degrees of Right Ascension.
The 360 degrees of the Sun’s path are measured from this point and described in terms of hours and minutes. The Solar Apex holds a position at approximately 18 hours of Right Ascension and is therefore in the first degree of Capricorn.
The entire solar system is headed toward a point that we term the Solar Apex which you can think of as an enormous magnet or compelling force.
The passage or transit of a slower moving planet (Saturn, Uranus, Neptune, Pluto and newly discovered Eris) across this important point has resulted in strong market moves. Uranus made passage of this degree on 12th March 2011 (geocentric perspective): coinciding with a sharp downward movement as can be seen below:
This next chart covers the most recent Saturn transit of this degree (again geocentrically): again coinciding with a decidedly negative few days of trading.
Saturn only crosses this degree every three decades and Uranus once every eight decades so that this information is not exciting news to the general trader. Even so, the fact that there was demonstrable activity coincident with these transits suggests that the degree of the Solar Apex and alignments with it should be given careful consideration.
You might like to note that both Saturn and Neptune align with the Solar Apex in 2025. This is highly unusual. They haven’t aligned at this point together in several thousand years. The combined effect could coincide with sharp decline in index values.
It may also be indicative of the dawn of a new financial global world order.
Copyright Christeen Skinner March 2018