INTRODUCTORY ARTICLE – NCGR TAIWAN – APRIL 22 2018
There are a few key building blocks that I wish had been aware of when I made my first foray into financial astrology two decades ago. They are as follows: –
- SOLAR ACTIVITY
Whatever the frequency of their trading, traders need to gauge potential volatility. In this respect, their first port of call should be to expected solar activity of any given period.
The Sun’s output is variable. It is perhaps unsurprising that bursts of energy in the Sun’s surface are often reflected in bursts of activity in the market place. Most people are familiar with the sunspots that appear on the Sun’s surface and the 11.2 year recognised rhythm associated with these. Those with keen interest in space weather, also pay attention to extra-ordinary bursts of energy known as Coronal Mass Ejections (CMEs) which have the potential to put satellites, terrestrial electric grids and information systems out of action and which, as a direct result, could bring chaos to the markets and, potentially, bring devastating financial loss to some individuals. Unlike the cycles of the orbiting planets, these CMEs can only be forecast a few days in advance and even then, vulnerable areas on Earth cannot be forecast with real accuracy.
Yet there is very useful information to be gathered from observations made by solar scientists. The term ‘radio flux’ is used to describe a solar rhythm that can be forecast for as much as 27 days in advance. When solar radio flux index rises above 50 there is increased market activity which gives valuable information to the frequent or daily trader.
This information can be found at www.spaceweather.com and is straightforward to use: when solar flux is high, then there is increased likelihood of market volatility. Some traders might prefer not to trade on these dates whereas others may alter their trading strategies to take account of the possibility of unusual conditions.
- THE SOLAR APEX
Our entire solar system is on the move. In the time taken to read this paragraph, the Sun, Earth, planets, moons, asteroids and other accumulated debris of the solar system will have travelled 3600 km. In directional terms it seems that the Sun is headed toward the Solar Apex: a position slightly southwest of the star, Vega.
This might mean nothing to you. Consider though that astronomers have worked out a way of mapping the celestial skies. Just as geographers use latitude and longitude to map a place on Earth, so astronomers use devices to map the heavens. These key measurements are Right Ascension and declination (the latter to be discussed later in this chapter).
Whereas the familiar longitudes and latitudes we use to determine where we are on Earth are determined from Earth’s Equator and the 0 meridian at Greenwich, Right Ascension ‘begins’ at the crossing point of the Sun’s path (the ecliptic) with the celestial equator: a point otherwise known as the Vernal Equinox. At this point in the Sun’s apparent journey around the Earth, it is measured as having zero degrees of Right Ascension.
The 360 degrees of the Sun’s path are measured from this point and described in terms of hours and minutes. The Solar Apex holds a position at approximately 18 hours of Right Ascension and is therefore in the first degree of Capricorn.
The entire solar system is headed toward a point that we term the Solar Apex which you can think of as an enormous magnet or compelling force.
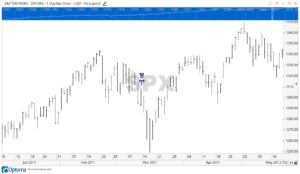
The passage or transit of a slower moving planet (Saturn, Uranus, Neptune, Pluto and newly discovered Eris) across this important point has resulted in strong market moves. Uranus made passage of this degree on 12th March 2011 (geocentric perspective): coinciding with a sharp downward movement as can be seen below:
This next chart covers the most recent Saturn transit of this degree (again geocentrically): again coinciding with a decidedly negative few days of trading.
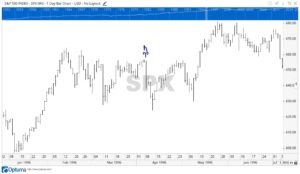
Saturn only crosses this degree every three decades and Uranus once every eight decades so that this information is not exciting news to the general trader. Even so, the fact that there was demonstrable activity coincident with these transits suggests that the degree of the Solar Apex and alignments with it should be given careful consideration.
You might like to note that both Saturn and Neptune align with the Solar Apex in 2025. This is highly unusual. They haven’t aligned at this point together in several thousand years. The combined effect could coincide with sharp decline in index values.
It may also be indicative of the dawn of a new financial global world order.
Copyright Christeen Skinner March 2018