
DAY CHARTS
Knowing which aspects will become exact during the course of the trading day is useful. Preparing a list is a worthwhile exercise and is one of my weekend tasks.
Though it is of some interest to cast a chart for the time that a market opens, I tend to focus on the chart for close of trade. Note that not all markets close at the same time of day: most close on the hour, a few on the half-hour. A Close of Trade chart for the All ordinaries in Sydney is unusual in that an extra 12 minutes is allowed to tidy up transactions. Charts for this index would be drawn for 16.12 local time.
It is very often the case that when a market closes with a planet EXACT on one of the angles of the chart for the precise location, then trading on that day is highly significant.
Though general planetary patterns affect all markets, it is quite possible for the market in Wall Street to close with a very different lunar aspect to the one in Sydney (there being a near 12 hour difference). A day that closes with an exact Moon-Uranus opposition in Sydney produces shock results and strong moves that are not experienced in other parts of the world.
Of particular interest are the Close of Trade charts at the end of each year. It is common at the start of any year for the various investment houses to give their opinion on where indices will be as the year closes. In my work I take into account long-term planet cycles, the position of the nodes and the close of trade charts for each index at the end of the year.
Throughout 2015 the nodal axis was in an up-curve of the McWhirter Business Cycle suggesting that indices should close the year higher. However, Uranus and Pluto were due to form a major aspect in March (possible upset) whilst in November, Saturn and Neptune would form the first of a series of right-angles (dampening prospects). On these factors alone I concluded that indices would end the year lower.
Arriving at the probable closing figure required review of the end of year trading chart. The London Stock Exchange closed for the year at 12.30pm on New Year’s Eve (December 31st).
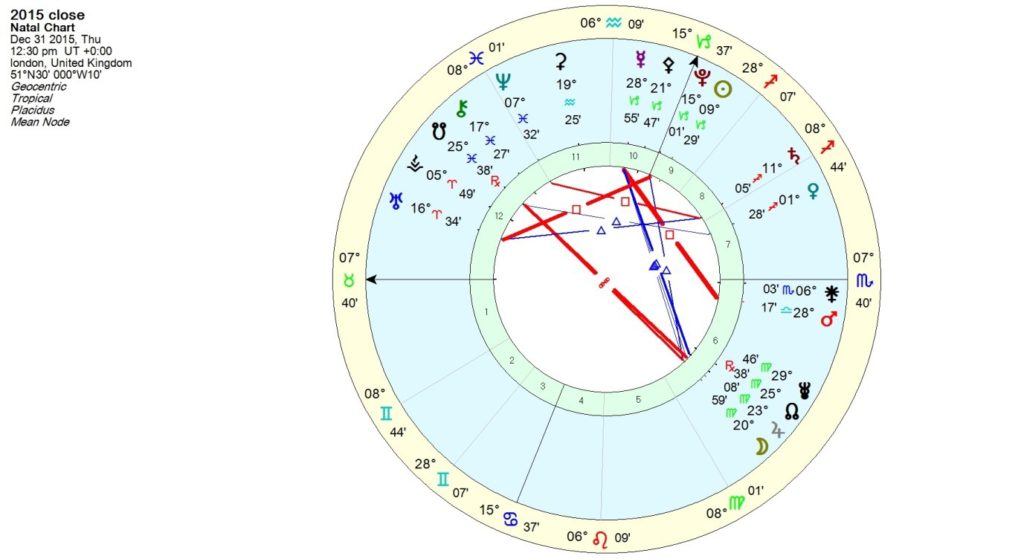
As may be seen, Pluto was exactly aligned with the Midheaven: indicating a powerful conclusion to trading for the year. This is, of course, the close of trade chart for both the day and the year. That being the case, greatest emphasis is given to the position of the slow moving planets and their aspects. In this instance, with Saturn having recently formed a right-angle to Neptune, there was high probability that 2015 would see significant losses – at least where UK markets were concerned. In fact, the FTSE closed 5% down on the year.
The same exercise for Wall Street delivered rather different results:
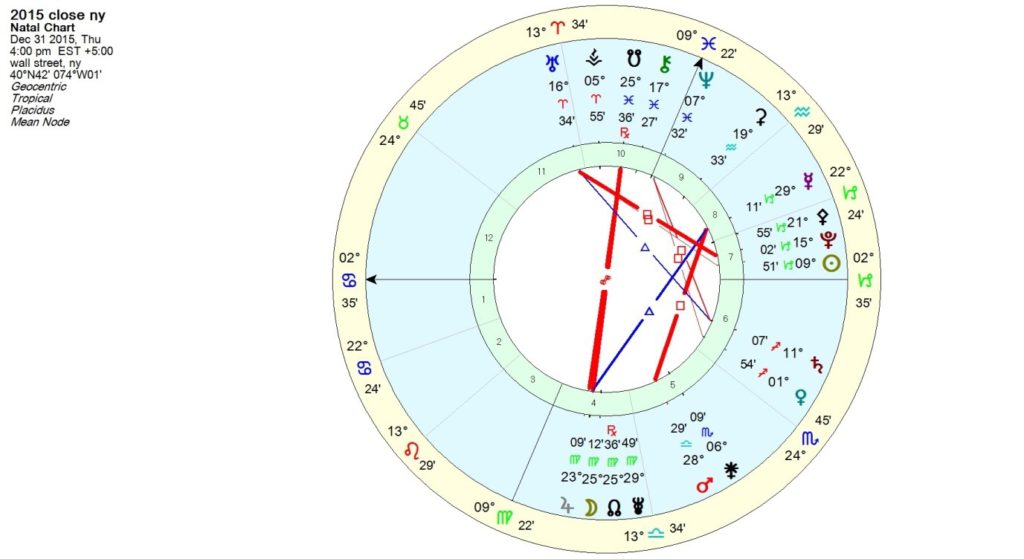
Here Neptune is exact at the Midehaven suggesting a confused picture. This chart also showed the Moon exactly aligned with the lunar North Node (an ‘up’ signal). Results in the US were indeed very different to those in the United Kingdom. The Dow Jones index closed down less than 1% on the year whilst the NASDAQ composite ended the year in positive territory.
Copyright Christeen Skinner March 2018